Dice That Decay
✨ A tray of dice traces out the same curve as radioactive atoms, half-life included.
🧰 You need
- about 100 dice, coins or numbered paper slips
- a tray or large box lid
- graph paper and a pencil
- a calculator
👀 What you will see
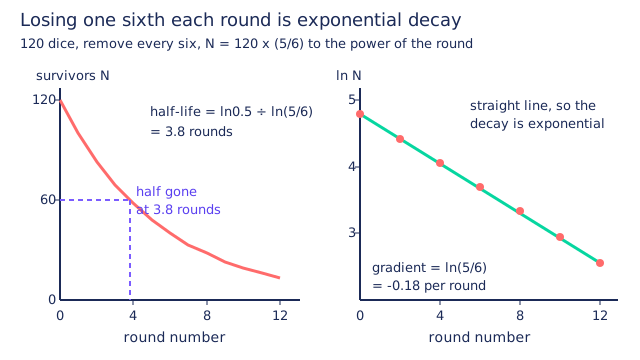
The survivor count falls steeply at first and then more gently, never quite reaching zero in a tidy way. The logarithm plot is close to a straight line with a negative gradient. The last few rounds are erratic, because small numbers are dominated by chance.
🧪 Do it
- Count your dice, record the starting number as round zero, and tip them all into the tray.
- Remove every die showing a six and record how many survivors remain.
- Return the survivors to the tray and repeat, recording the survivor count after each round.
- Continue for twelve rounds or until no dice are left.
- Plot survivors against round number and draw a smooth curve through the points.
- Plot the natural logarithm of survivors against round number and draw the best straight line.
- Read off the number of rounds needed to halve the population and compare it with the predicted 3.8 rounds.
💡 Why it happens
Each die has a one in six chance of removal per round, so on average five sixths of the survivors remain, giving N equals N zero times five sixths to the power of the round number. Losing a constant fraction per round rather than a constant number is the definition of exponential decay. The number of rounds to halve the population, the half-life, is the same whatever number you start with, and here it is log 0.5 divided by log five sixths, about 3.8 rounds. Taking logarithms turns the curve into a straight line, which is exactly how scientists test whether real data such as radioactive decay or a drug clearing from blood is truly exponential.
🔁 Now try this
Repeat with coins, removing every head so that half go each round, and compare the measured half-life with the predicted one round.
🤔 Think about it
Why does the curve become so bumpy once only a handful of dice are left?
🧘 Ask the Acharya
“Why does the curve become so bumpy once only a handful of dice are left?” — ask him and he will explain it from your own chapters.
More for Std 9–12
Measure Gravity With a String
Six lengths of string, a stopwatch and one graph hand you the strength of Earth's gravity to within a few per cent.
Try it →Science40 minHow Fast Does It Fizz
The kitchen scale reading falls in real time, and the steepness of that fall is the speed of the reaction.
Try it →Science30 minHeart Rate Recovery Curve
The shape of your own recovery curve says more about your fitness than the peak number ever could.
Try it →